New Graph Maps Density and Mass of 2,000+ Astronomical Objects
The Gist
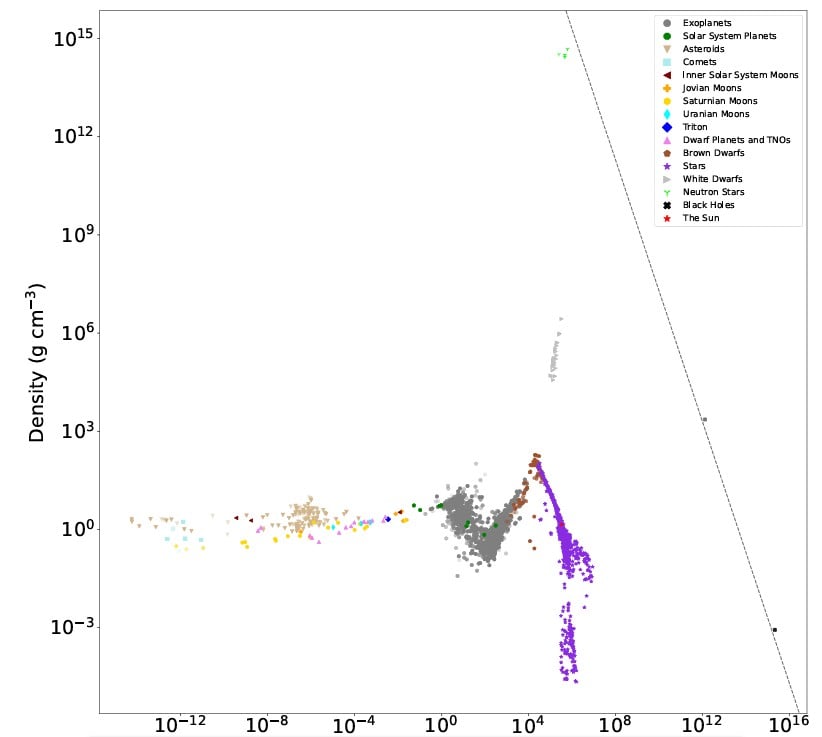
A new graph, the Cohesive Object Sequence, maps the density of over 2,000 astronomical objects against their mass.
Explain Like I'm Five
"Imagine a chart that shows how heavy and squished different things in space are, from tiny rocks to giant stars! It helps us understand what they're made of and how they're different."
Deep Intelligence Analysis
The graph highlights a transition point between irregular asteroids and spherical moons, influenced by material composition. It also distinguishes between terrestrial planets, volatile-rich planets, and gas giants based on their mass-density relationships. The lack of a clear distinction between super-massive gas giants and brown dwarfs raises questions about the current classification system.
While the Cohesive Object Sequence offers a valuable tool for visualizing astronomical data, it is important to acknowledge its limitations. The exclusion of objects without well-defined surfaces restricts its applicability, and the interpretation of the graph's patterns requires careful consideration of the underlying physical processes. Further research is needed to validate the graph's findings and explore its potential for advancing our understanding of the universe.
_Context: This intelligence report was compiled by the DailyOrbitalWire Strategy Engine. Verified for Art. 50 Compliance._
Impact Assessment
This graph provides a visual map of astronomical objects based on density and mass, similar to the Hertzsprung-Russell diagram for stars. It reveals connections and inflection points that are not readily apparent through observation alone, potentially leading to new insights into the composition and evolution of celestial bodies.
Read Full Story on Universe TodayKey Details
- ● The graph plots the density of over 2,000 astronomical objects against their mass.
- ● The objects range in size from the asteroid Itokawa to blue supergiant stars.
- ● The graph covers 12 orders of magnitude.
- ● The graph includes black holes, defining the event horizon as a physical boundary.
Optimistic Outlook
The Cohesive Object Sequence could become a valuable tool for understanding the relationships between different types of astronomical objects. By visually representing the connections between mass and density, it may help identify new research avenues and refine existing models of planetary and stellar formation.
Pessimistic Outlook
The graph excludes nebulae and galaxies, limiting its scope. The reliance on well-defined surfaces may introduce bias, and the interpretation of the graph's patterns could be subjective, potentially leading to misinterpretations or oversimplifications of complex astrophysical processes.
The Signal, Not
the Noise|
Get the week's top 1% of space-tech intelligence synthesized into a 5-minute read. Join 25,000+ aerospace insiders.
Unsubscribe anytime. No spam, ever.